
If you’re trying to integrate Amazon Bedrock AgentCore Observability with AWS Lambda, the docs will confuse the hell out of you.
Not because they’re wrong - they’re just written for containerized environments (ECS, EKS) and assume you know the difference between collector-based and embedded agent patterns.
You probably don’t know which is which. Neither did I - spent a day debugging why none of the documented env vars worked.
Here’s what actually works.
Context: What We’re Building #
We’re running AI agents in AWS Lambda as async backend tasks - event-driven, not human-interactive. Think SQS triggers, EventBridge events, background processing with AI reasoning.
This is different from AgentCore Runtime (the managed, conversational runtime). When you run agents outside AgentCore Runtime, you lose session metrics but keep traces, metrics, and logs.
I’ll write a separate post on which runtime to use when. Today: just getting observability working in Lambda.
The Problem with the Docs #
AgentCore observability docs assume you’re running agents in containers with this architecture:
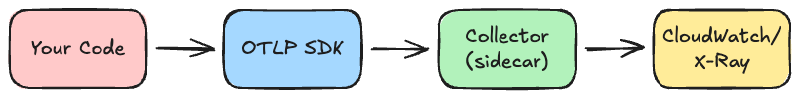
But modern AWS Lambda with ADOT layer uses a completely different pattern:
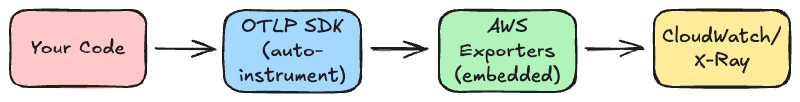
No collector. No sidecar. In-process embedded agent.
The docs don’t clarify this, so you end up cargo-culting env vars from three different sources that contradict each other.
Prerequisites #
Step 1: Enable CloudWatch Transaction Search #
This is a one-time setup per region. You need this before anything else works.
Option 1: Using AWS CLI
Create the resource policy:
aws logs put-resource-policy \
  --policy-name MyResourcePolicy \
  --policy-document '{
    "Version": "2012-10-17",
    "Statement": [{
      "Sid": "TransactionSearchXRayAccess",
      "Effect": "Allow",
      "Principal": { "Service": "xray.amazonaws.com" },
      "Action": "logs:PutLogEvents",
      "Resource": [
        "arn:aws:logs:region:account-id:log-group:aws/spans:*",
        "arn:aws:logs:region:account-id:log-group:/aws/application-signals/data:*"
      ],
      "Condition": {
        "ArnLike": { "aws:SourceArn": "arn:aws:xray:region:account-id:*" },
        "StringEquals": { "aws:SourceAccount": "account-id" }
      }
    }]
  }'
Configure trace destination:
aws xray update-trace-segment-destination --destination CloudWatchLogs
Optional - configure sampling:
aws xray update-indexing-rule \
  --name "Default" \
  --rule '{"Probabilistic": {"DesiredSamplingPercentage": 10}}'
Option 2: Using Console
- Open CloudWatch console → Settings → X-Ray traces tab
- Transaction Search section → View settings → Edit
- Enable Transaction Search
- Select “Enable Transaction Search” and set sampling percentage (1% free tier)
- Wait until “Ingest OpenTelemetry spans” shows Enabled
AWS Docs: Enabling Transaction Search
Lambda Setup #
Runtime Version: Python 3.12 #
Python 3.13 is supported but has a bug as of writing. Use Python 3.12 - it’s the latest stable version.
Critical: Your Strands layer must be built with Python 3.12 to match the Lambda runtime (Pydantic is version-sensitive).
Example Agent Code #
Here’s a simple Strands agent in Lambda:
import json
import logging
from strands import Agent, tool
from strands.models import BedrockModel

logger = logging.getLogger()
logger.setLevel(logging.INFO)

@tool
def weather():
    """Get weather"""
    return "sunny"

model = BedrockModel(model_id="eu.anthropic.claude-haiku-4-5-20251001-v1:0")
agent = Agent(
    model=model,
    tools=[weather],
    system_prompt="You're a helpful assistant. You can tell the weather."
)

def lambda_handler(event, context):
    user_input = "How is the weather"
    response = agent(user_input)

    result = {
        "statusCode": 200,
        "body": json.dumps({"message": response})
    }

    logger.info("Operation completed successfully")
    return result
Framework Note: I’m using Strands because it’s my default agent framework in AWS, but this setup works the same with LangChain, LangGraph, CrewAI, or any other agent framework that supports OpenTelemetry instrumentation. The three environment variables and ADOT layer configuration remain identical.
Create Strands Lambda Layer #
Build the layer with platform-specific dependencies:
# Match your Lambda runtime version
python3.12 -m pip install strands-agents \
  --platform manylinux2014_x86_64 \
  --only-binary=:all: \
  -t python/

# Or with OpenTelemetry extras
python3.12 -m pip install 'strands-agents[otel]' \
  --platform manylinux2014_x86_64 \
  --only-binary=:all: \
  -t python/

# Package it
zip -r strands-layer.zip python/
Upload to Lambda as a layer.
Lambda Configuration #
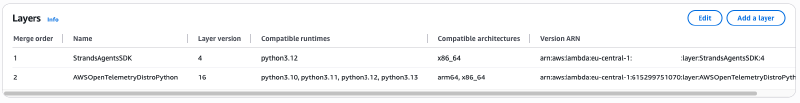
1. Add Layers
- ADOT Lambda Layer (find ARN for your region: ADOT Lambda Layers)
- Your Strands layer
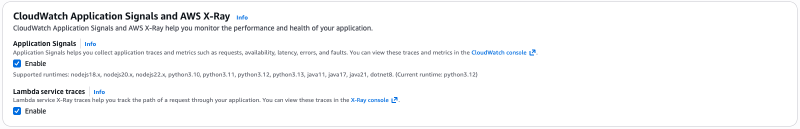
2. Enable Monitoring Tools
Lambda Console → Your Function → Configuration → Monitoring and operations tools → Edit
Enable both:
- ✅ Application Signals
- ✅ Lambda service traces
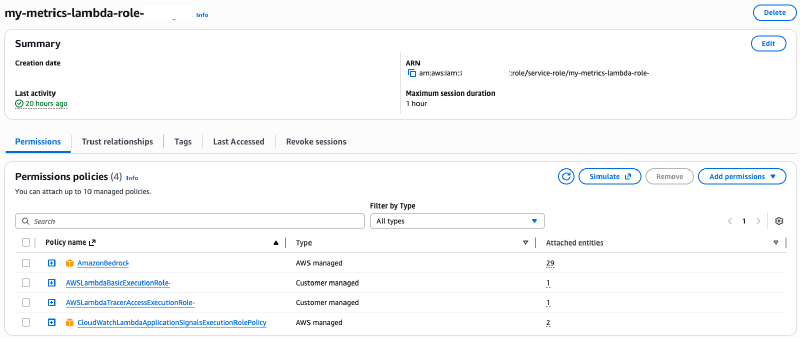
3. Add IAM Policy
Attach CloudWatchLambdaApplicationSignalsExecutionRolePolicy to your Lambda execution role.
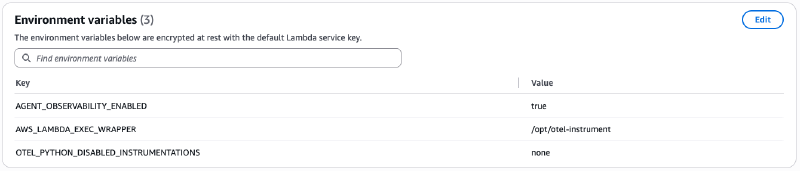
4. Environment Variables
Here’s the magic. Just three environment variables:
AGENT_OBSERVABILITY_ENABLED=true
AWS_LAMBDA_EXEC_WRAPPER=/opt/otel-instrument
OTEL_PYTHON_DISABLED_INSTRUMENTATIONS=none
That’s it. Nothing else.
Why This Works #
The ADOT Lambda layer uses an embedded agent pattern, not a collector.
When you set AWS_LAMBDA_EXEC_WRAPPER=/opt/otel-instrument, the layer wraps your function with auto-instrumentation that exports directly to CloudWatch and X-Ray.
Why OTEL_PYTHON_DISABLED_INSTRUMENTATIONS=none?
AWS ADOT Lambda layer tries to be lightweight by default - it disables heavier instrumentations (logging integrations, deep library hooks) to keep cold starts low. Setting this to none tells ADOT: “no, instrument everything.” Without this, you’ll miss critical agent framework telemetry.
All those other OTEL env vars you see in the docs (OTEL_EXPORTER_OTLP_PROTOCOL, OTEL_EXPORTER_OTLP_LOGS_HEADERS, OTEL_PYTHON_DISTRO, etc.) are for:
- Containerized environments with collector sidecars (ECS/EKS)
- Legacy Lambda collector pattern (outdated)
- AgentCore Runtime-specific configuration
In modern Lambda with ADOT layer, they’re either redundant or conflict with the auto-configuration.
AGENT_OBSERVABILITY_ENABLED=true tells your agent framework to enable observability.
The ADOT layer handles everything else.
What You Get #
After deployment and invocation, your traces show up in CloudWatch Application Signals, X-Ray Service Map, and CloudWatch Logs Insights:
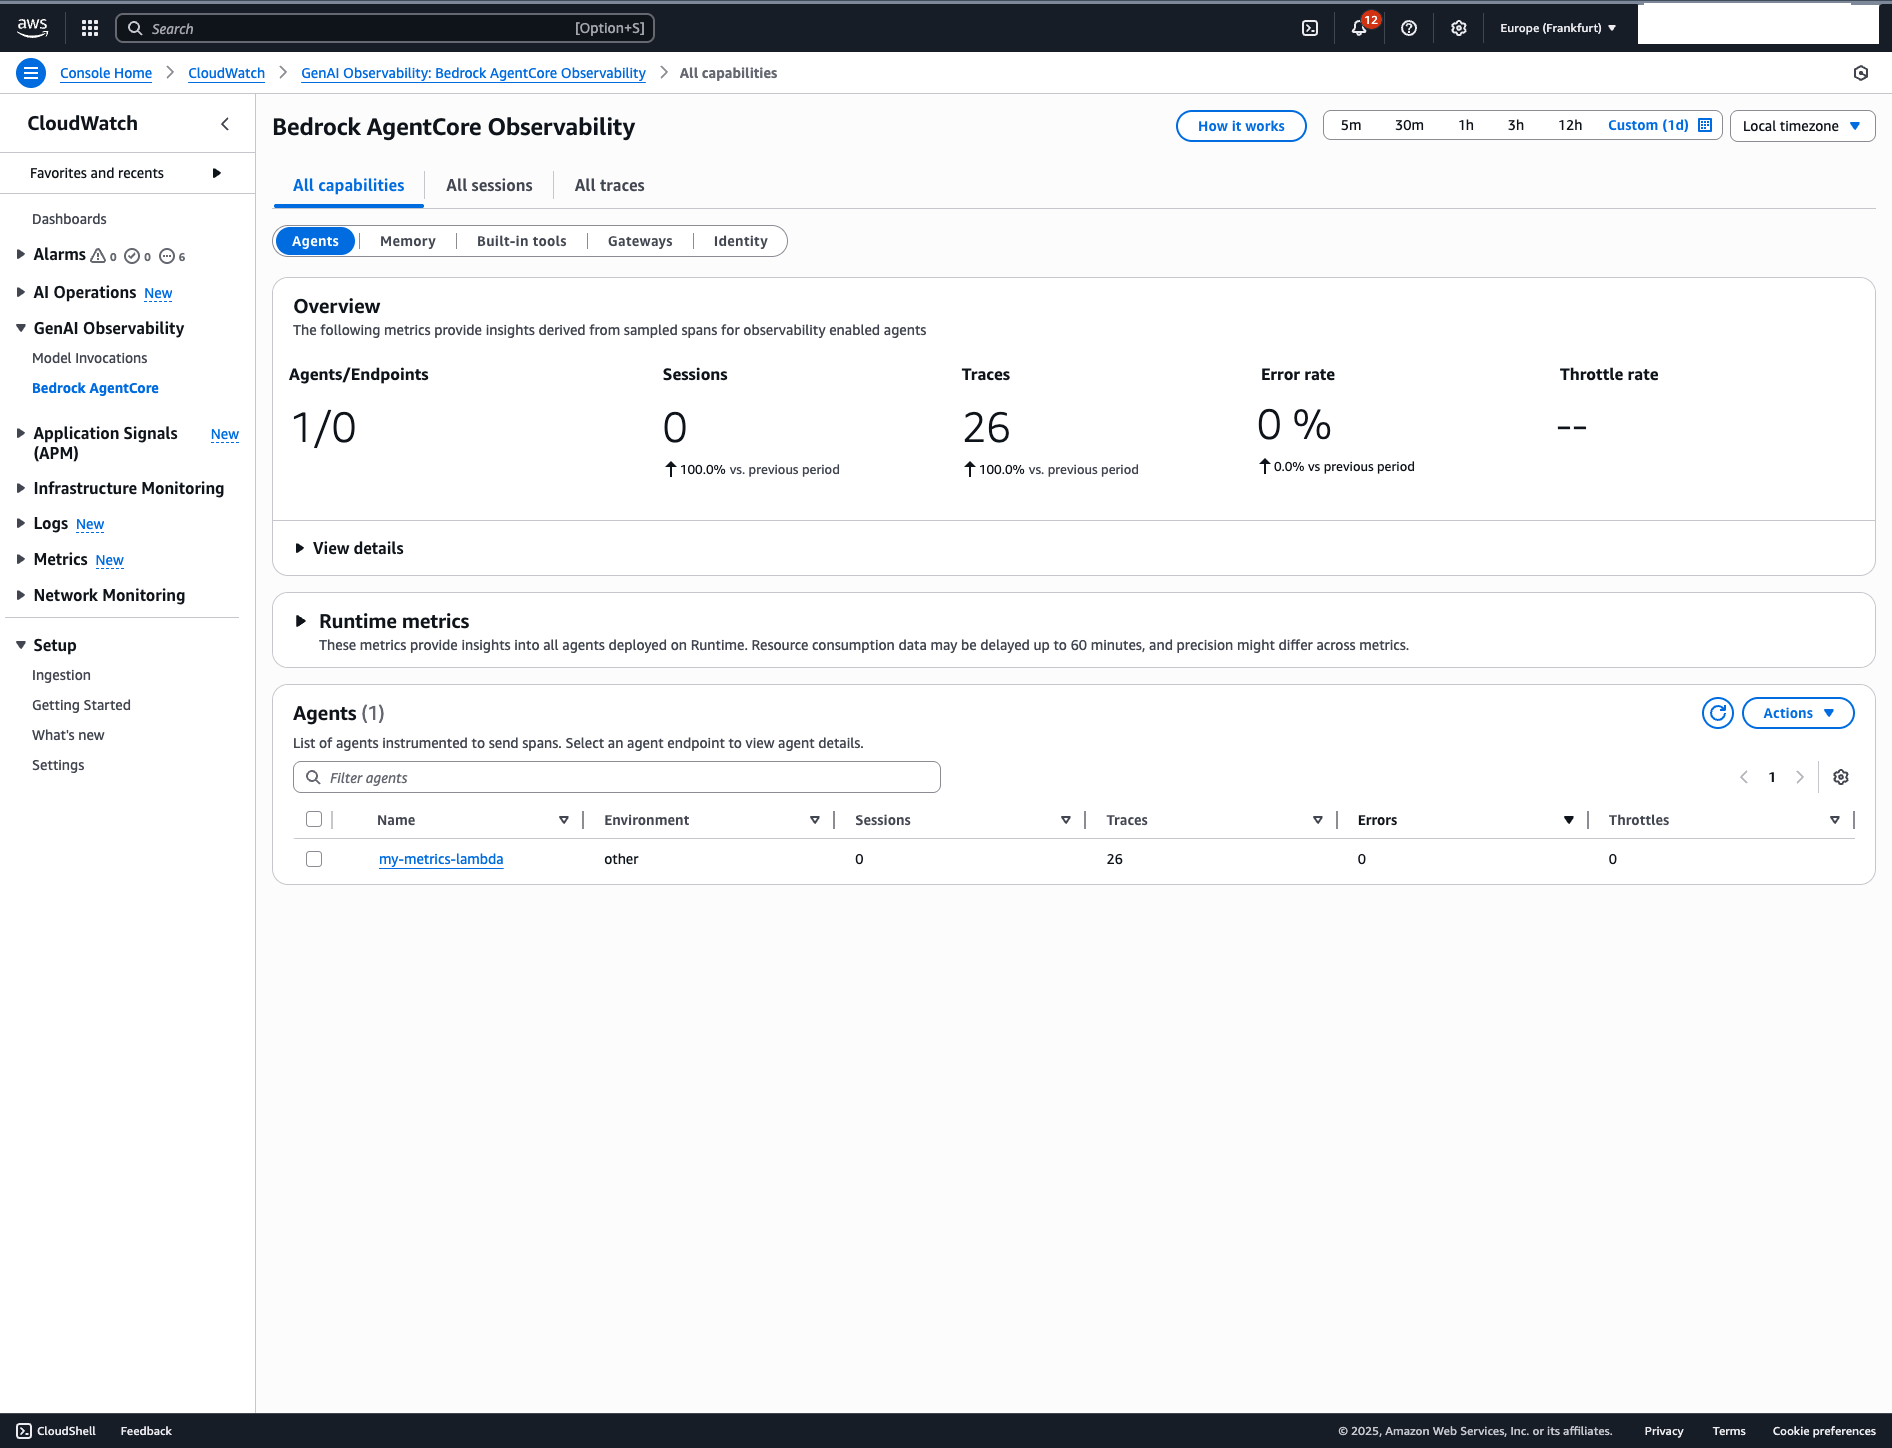
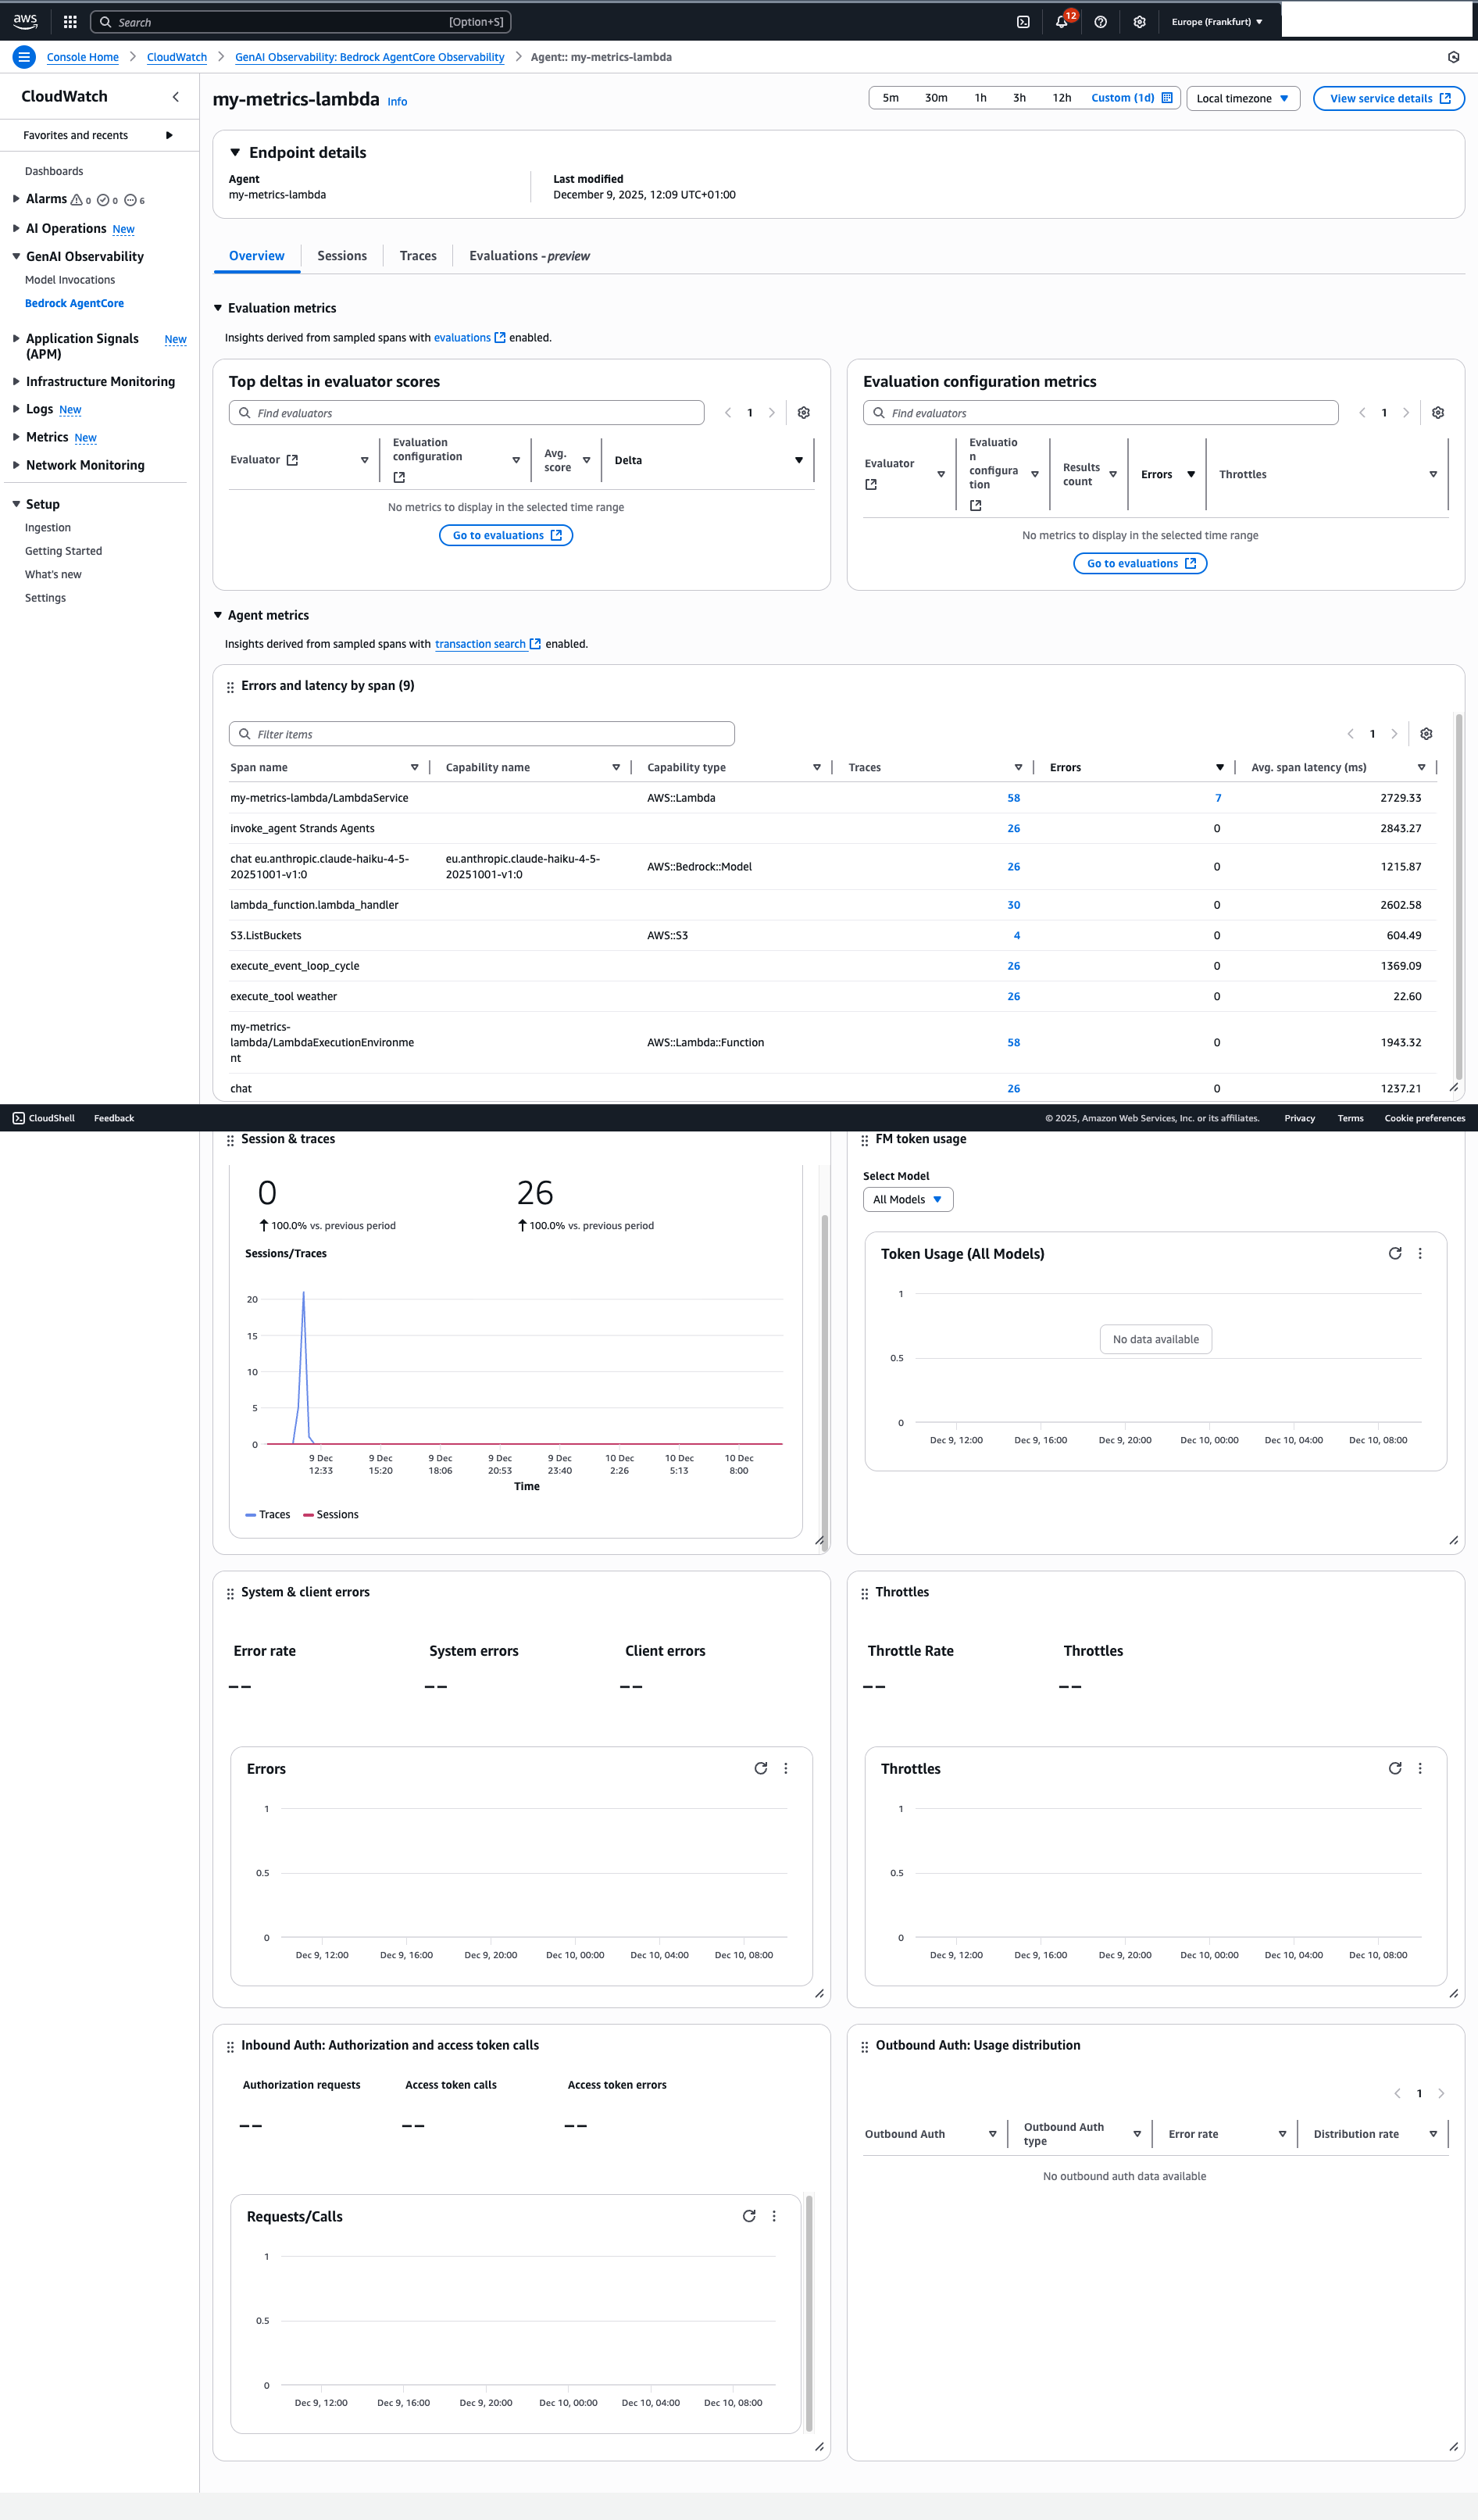
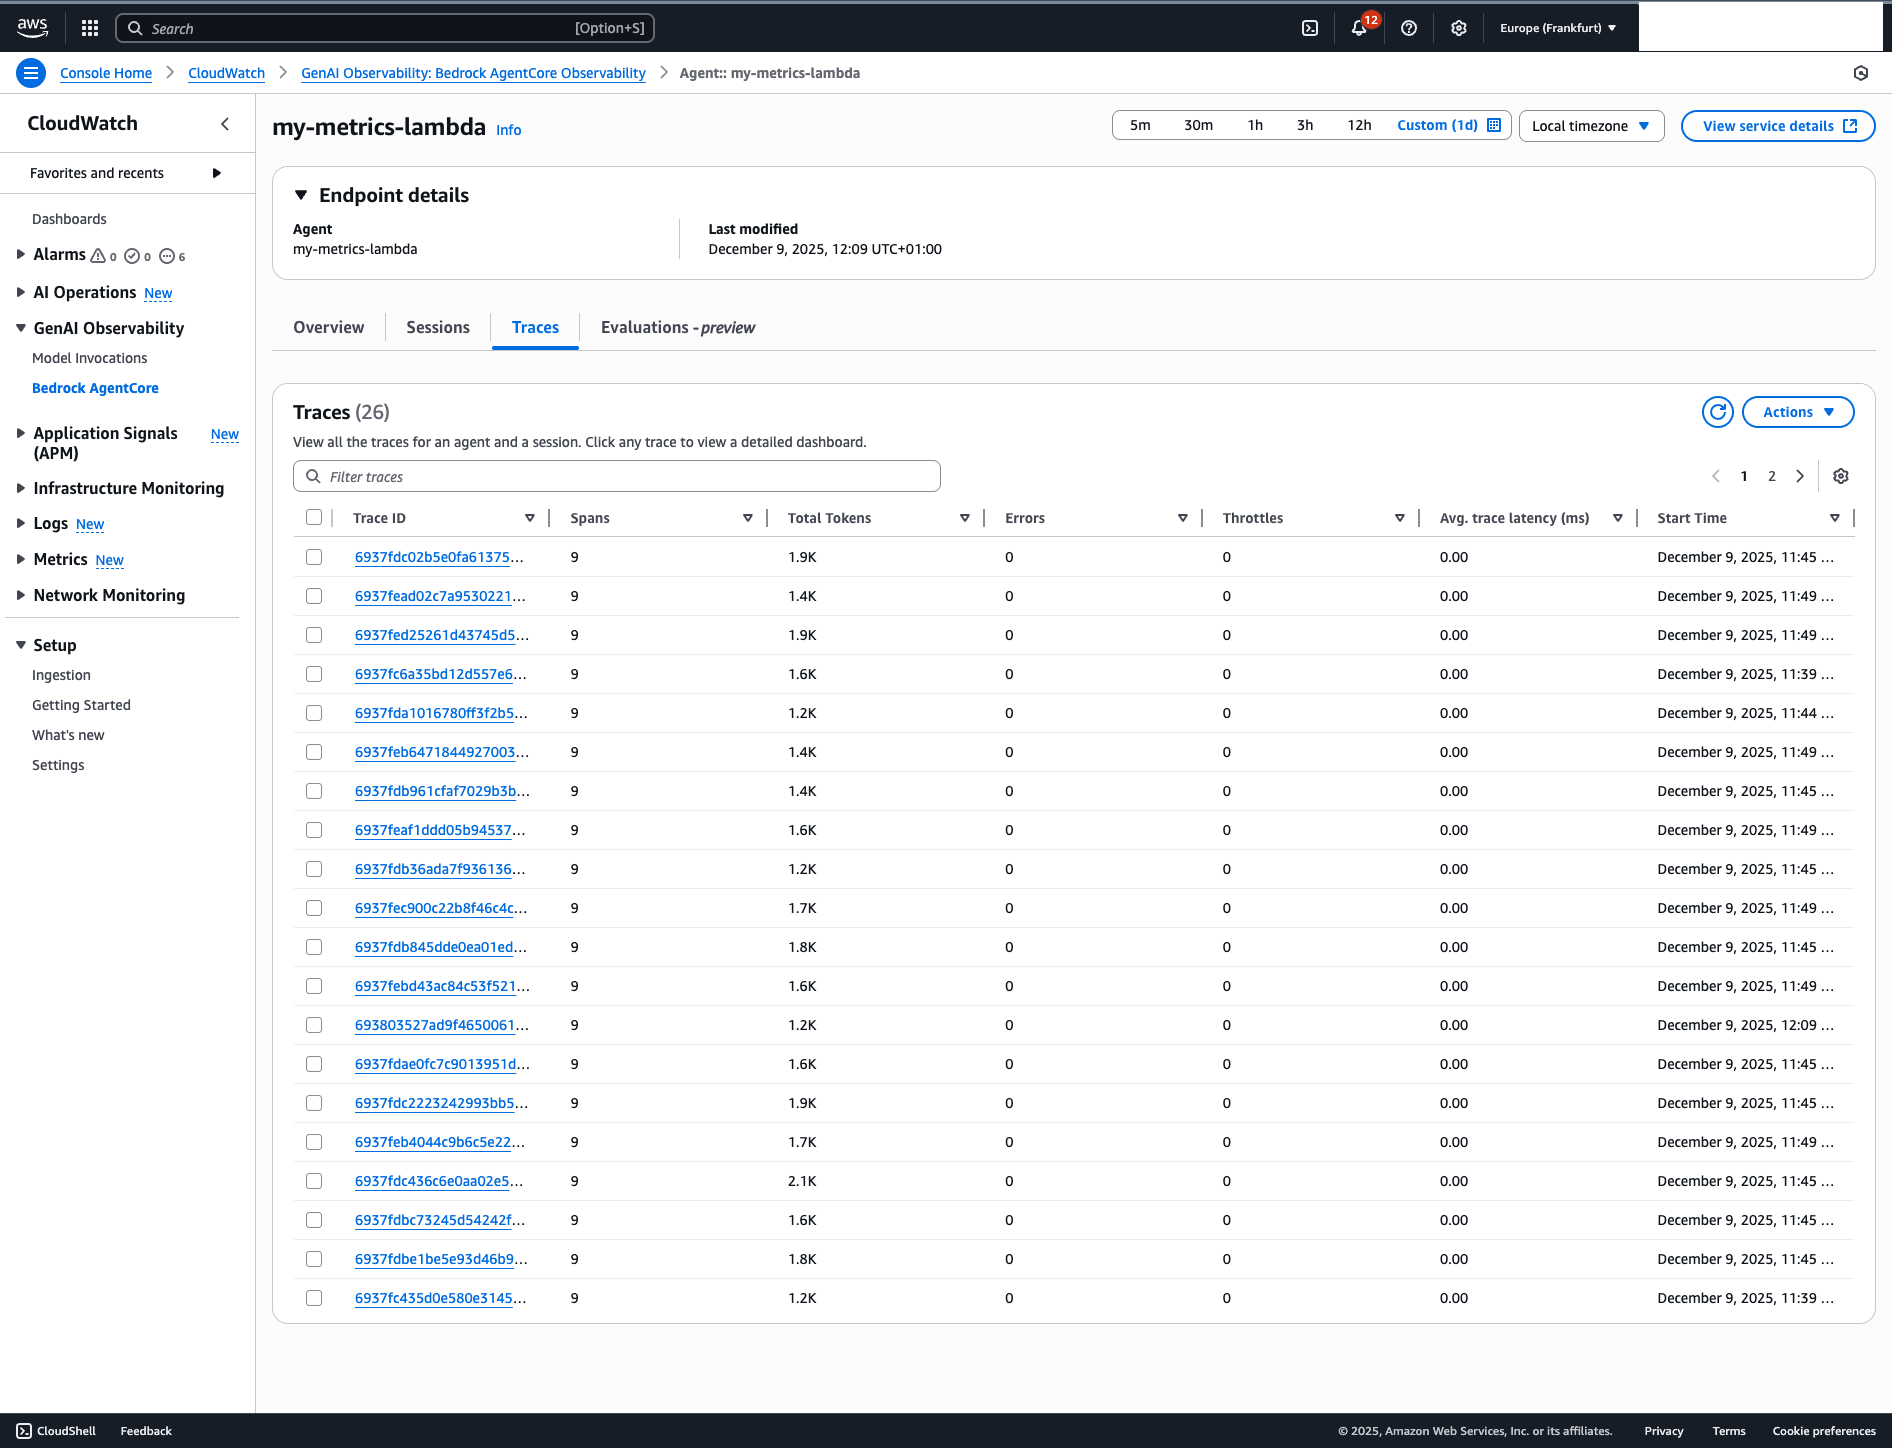
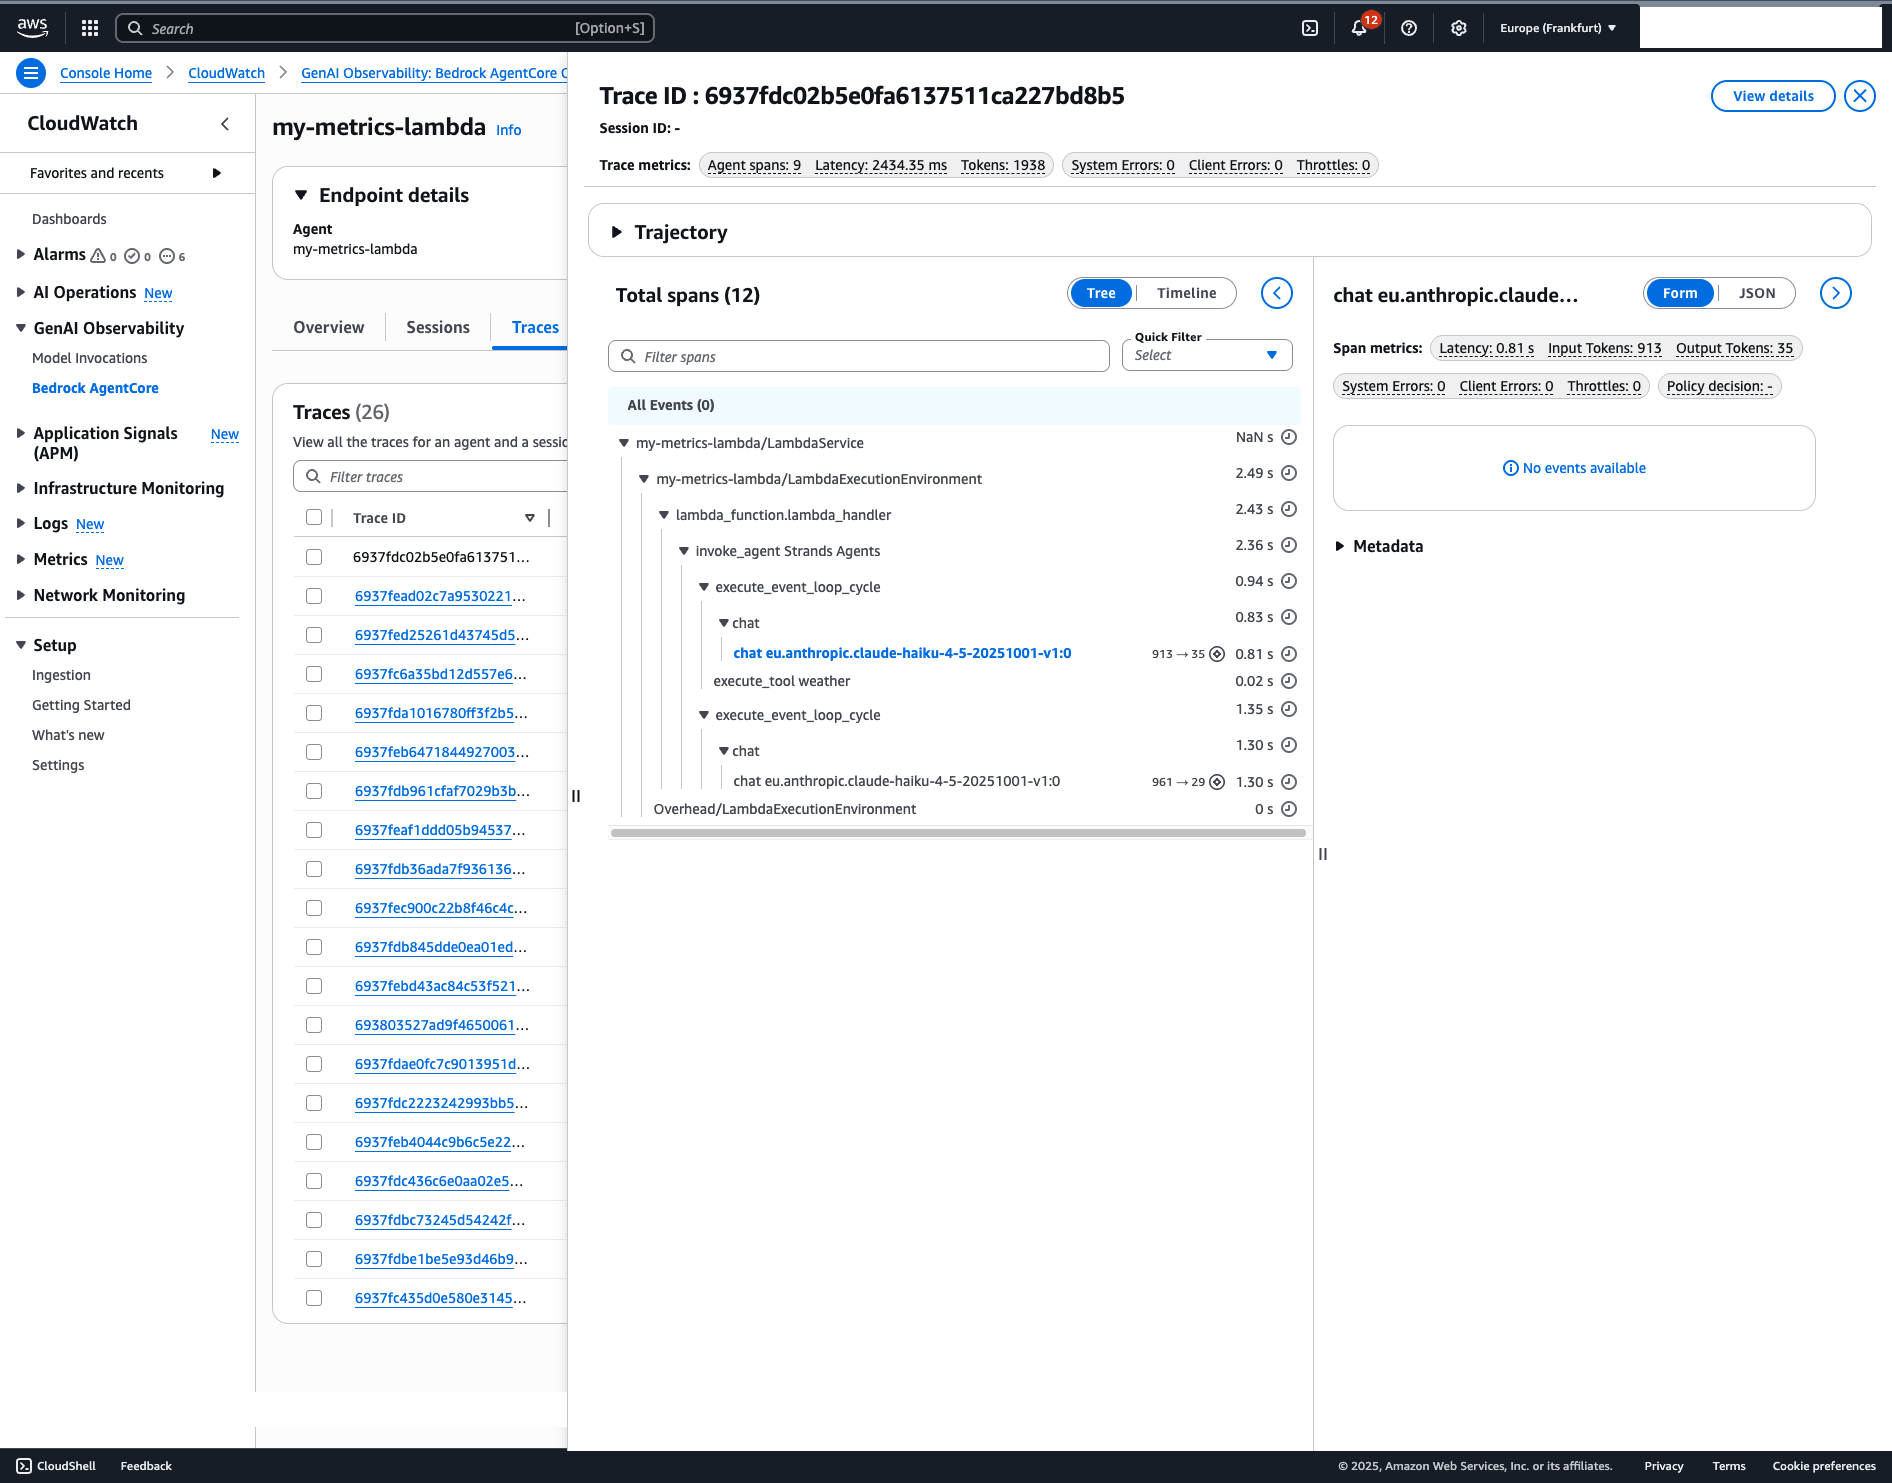
You’ll see:
- Agent invocations
- Tool calls
- Model interactions
- Latency metrics
- Error traces
What you DON’T get:
- Session metrics (only available in AgentCore Runtime)
Session metrics make sense for conversational, human-interactive agents. If you’re running event-driven backend agents in Lambda, you don’t need them.
The Docs Confusion Explained #
If you follow the AgentCore observability setup docs, you’ll see instructions for containerized environments:
What the docs say:
# Configure AWS environment variables
export AWS_ACCOUNT_ID=<account id>
export AWS_DEFAULT_REGION=<default region>
export AWS_REGION=<region>
export AWS_ACCESS_KEY_ID=<access key id>
export AWS_SECRET_ACCESS_KEY=<secret key>

# Configure OpenTelemetry environment variables
export AGENT_OBSERVABILITY_ENABLED=true
export OTEL_PYTHON_DISTRO=aws_distro
export OTEL_PYTHON_CONFIGURATOR=aws_configurator
export OTEL_EXPORTER_OTLP_PROTOCOL=http/protobuf
export OTEL_EXPORTER_OTLP_LOGS_HEADERS=x-aws-log-group=<YOUR-LOG-GROUP>,x-aws-log-stream=<YOUR-LOG-STREAM>,x-aws-metric-namespace=<YOUR-NAMESPACE>
export OTEL_RESOURCE_ATTRIBUTES=service.name=<YOUR-AGENT-NAME>
The observability configuration docs show even more:
AGENT_OBSERVABILITY_ENABLED=true
OTEL_PYTHON_DISTRO=aws_distro
OTEL_PYTHON_CONFIGURATOR=aws_configurator
OTEL_RESOURCE_ATTRIBUTES=service.name=<agent-name>,aws.log.group.names=/aws/bedrock-agentcore/runtimes/<agent-id>,cloud.resource_id=<AgentEndpointArn:AgentEndpointName>
OTEL_EXPORTER_OTLP_LOGS_HEADERS=x-aws-log-group=/aws/bedrock-agentcore/runtimes/<agent-id>,x-aws-log-stream=runtime-logs,x-aws-metric-namespace=bedrock-agentcore
OTEL_EXPORTER_OTLP_PROTOCOL=http/protobuf
OTEL_TRACES_EXPORTER=otlp
Why this doesn’t work in Lambda:
These docs assume collector pattern architecture - your code exports OTLP to a sidecar collector (see the container diagram above).
But Lambda with ADOT layer uses embedded agent pattern (see the FaaS diagram above) - no collector, no sidecar, in-process instrumentation.
What breaks if you use the docs’ env vars:
- AWS credential exports aren’t needed (Lambda IAM role handles this)
OTEL_PYTHON_DISTRO=aws_distroandOTEL_PYTHON_CONFIGURATOR=aws_configuratorconfigure collector-less direct export - contradicts the collector architecture they’re documentingOTEL_EXPORTER_OTLP_PROTOCOL=http/protobufconfigures OTLP export to a collector that doesn’t exist in LambdaOTEL_EXPORTER_OTLP_LOGS_HEADERS=x-aws-log-group=...tries to configure collector endpoint headersaws.log.group.names=/aws/bedrock-agentcore/runtimes/<agent-id>is AgentCore Runtime-specific (managed runtime, not your Lambda)
These env vars either conflict with ADOT layer auto-configuration or are completely unnecessary.
The docs aren’t wrong - they’re container-first. Lambda FaaS with embedded ADOT is a different execution model. The docs don’t bridge this gap.
Debugging Tips #
If traces don’t appear:
- Wait 5-10 minutes after enabling Transaction Search
- Check IAM permissions include
CloudWatchLambdaApplicationSignalsExecutionRolePolicy - Verify both ADOT and Strands layers are attached
- Confirm Python runtime is 3.12
- Check CloudWatch Logs for OTEL export errors
If you see “Failed to export” errors, you probably have conflicting OTEL env vars from the docs. Remove everything except the three listed above.
Wrap #
TL;DR for Lambda + AgentCore Observability:
- Enable CloudWatch Transaction Search (per-region, one-time)
- Python 3.12 runtime
- Add ADOT + Strands layers
- Enable Application Signals + Lambda service traces
- Add IAM policy
- Set exactly 3 env vars
That’s the working config. No collector. No 10+ environment variables. No cargo-culting from container docs.
If you’re running agents in Lambda for async backend processing, this gets you full observability without the session metrics you don’t need anyway.
Running AI agents in production? The boring backend stuff nobody talks about is where the real work happens.
— The Pragmatical Architect